GS logo

GS

Goldman Sachs Group, Inc.

$891.91

0.23%

Trade Ideas Performance

Latest Closed Trade Idea

$891.91

0.23%
Loading...
We are loading your data. Please wait a moment.

Sentiment

News

5

Social

3

About

Events of Goldman Sachs Group, Inc. (GS)

In the past six months (April 2026 - October 2026), The Goldman Sachs Group, Inc. (GS) stock experienced fluctuations. On April 13, 2026, Q1 earnings were reported at $17.55 EPS with a 19.8% annualized return on common equity. Q2 earnings, reported on July 14, 2026, showed $20.98 EPS and a 23.5% annualized return on common equity. The stock's 52-week high was $1,153.99 and its 52-week low was $740.01. As of October 9, 2026, the closing price was $895.32. Over the last four weeks leading up to October 9, 2026, the stock gained 12.20%, but it was down 12.97% over the past 30 days. Shares decreased to $914.41 in late September 2026 and further to $978.75 in July 2026. Analysts have a median target of $909.70 for the stock.

FAQ

Related Assets

Price action provided by Massive. Fundamentals, news and corporate events provided by FactSet. NLP support provided by Perplexity & Gemini. All data is provided for informational purposes only.

Make every trade make sense.

Sign up free. No card required. Three trade ideas a day, the AI analyst, the community - on us.
Get started for FREE (opens in new tab)
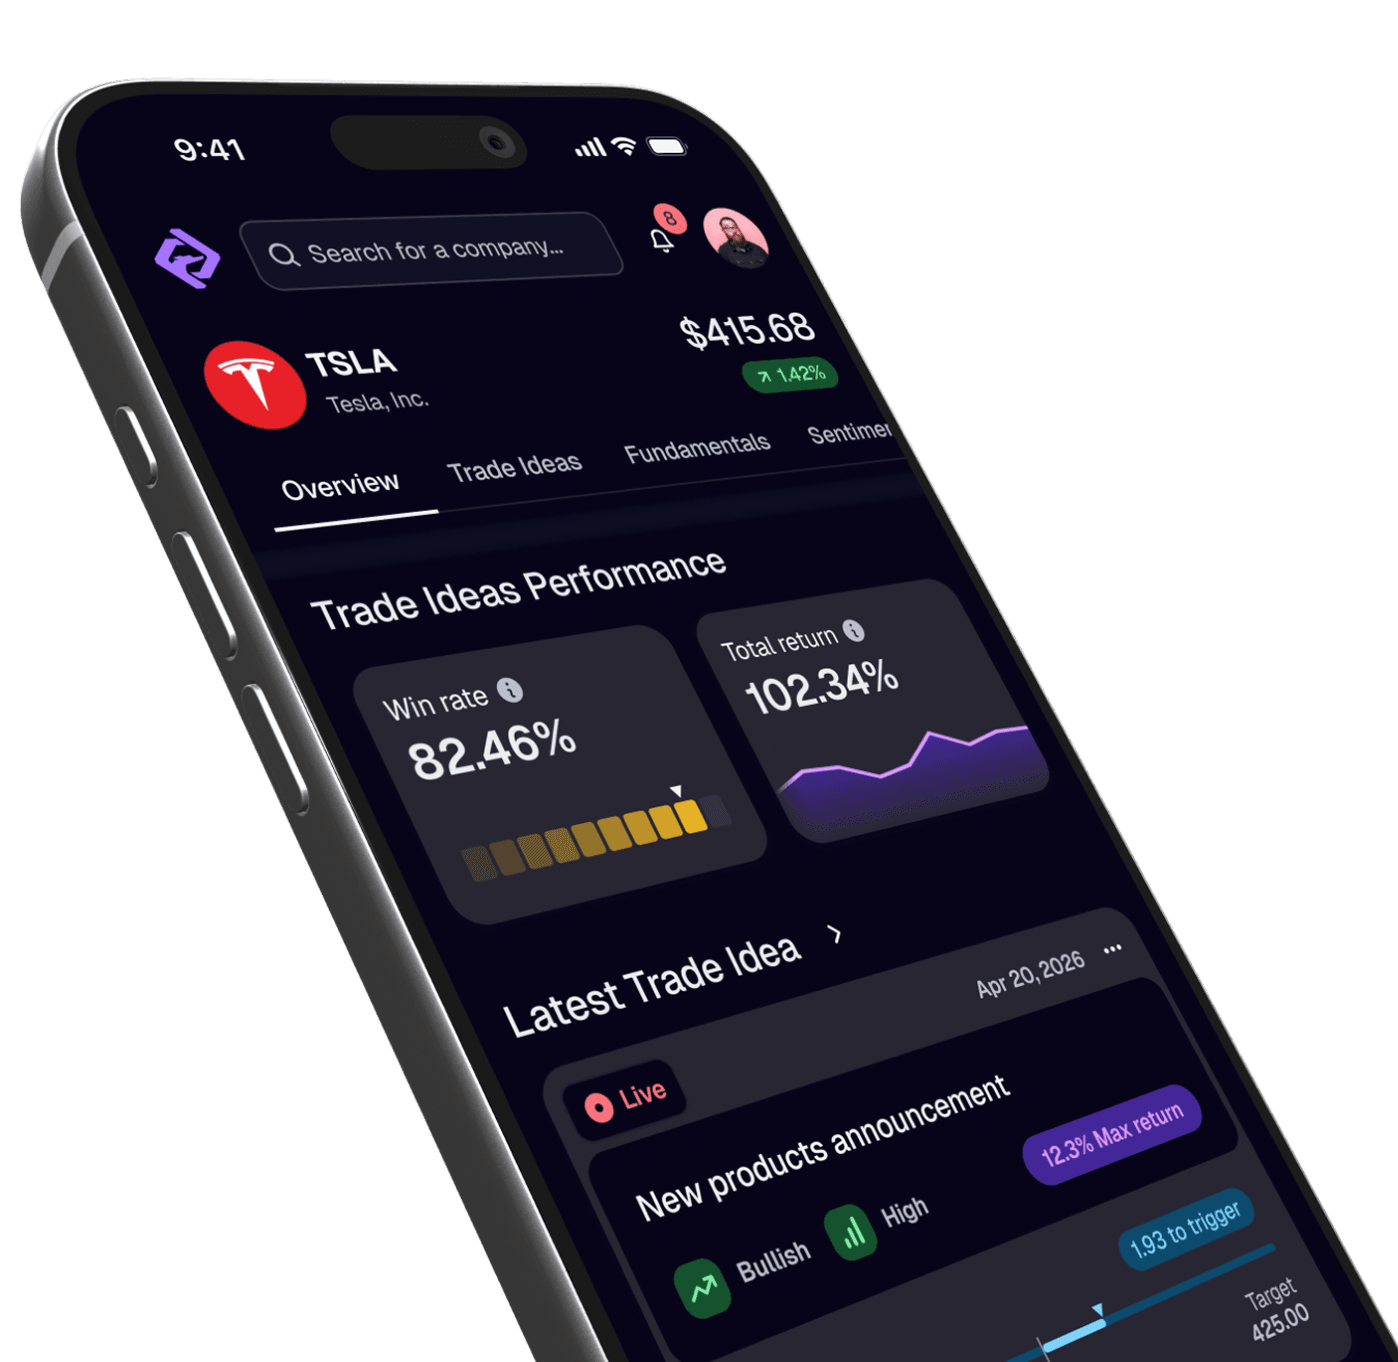
Edge Hound mobile app preview on iPhone

Join us and trade with people
who think like you.

The Edge Hound Discord is where serious self-directed investors talk strategy, share setups, and learn from each other. Free to join with any plan - including Free.

Free to join with any plan - including Free.

Join our Discord community (opens in new tab)